![[SAFETY]](safety.jpg)
![[BAR]](bar.gif)
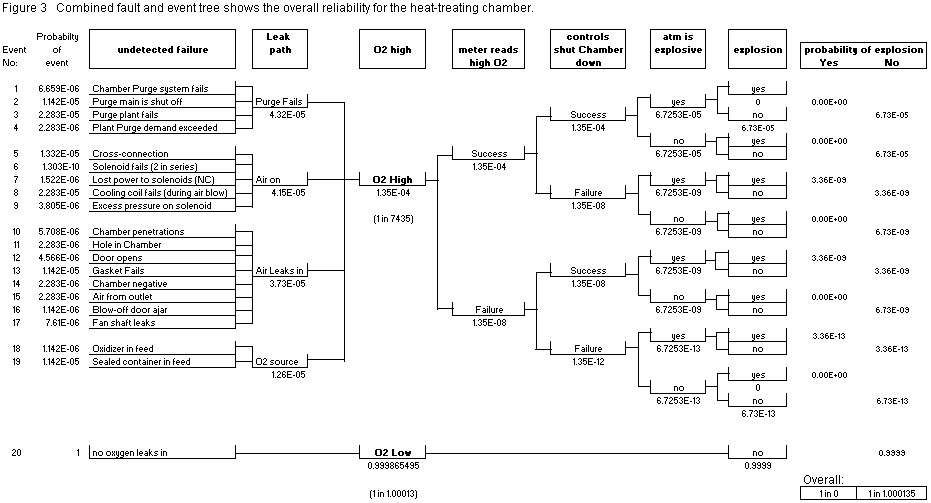
| Table 1. Predicted outcomes for the explosion hazards in the heat-treating chamber. |
| Event | Probability | Odds |
| Normal Operation | 9.999E-01 | 1 in 1.000135 |
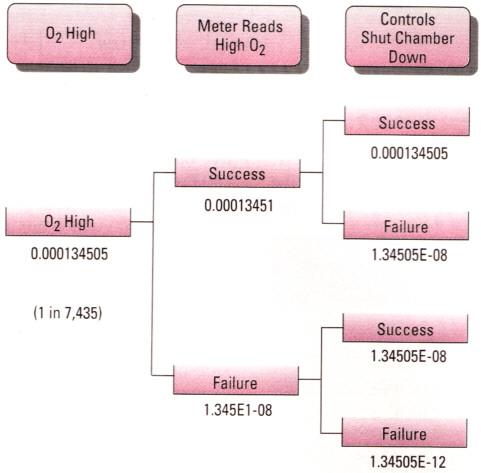
| Oxygen High (alone) | 1.345E-04 | 1 in 7,435 |
| Oxygen High with no explosion | 1.345E-04 | 1 in 7,434 |
| Oxygen High with explosion | 6.726E-09 | 1 in 148,685,875 |
| CEP |